Built for data teams

Turn spatial data into answers.

Ask in natural language and explore answers with charts and maps in a chat-map workspace built for spatial analysis. Connect your data, or start from curated samples.

Workspace
Cologne flood risk
Chat Data Map
Map 100-year flood depth and highlight cells with population above 1,000 in the district of Cologne.
In the Cologne district, 265 H3 cells show 100-year flood depth up to 10.1 m. Cells with population above 1,000 cluster along the Rhine and inner-city corridors.
265cells mapped
10.1mmax depth
💡 Insights
  • Highest flood depths concentrate near the Rhine floodplain in western Cologne.
  • All highlighted cells exceed 1,000 residents. Exposure is widespread across the district.
Flood depth by return period
3m2m1m0
0.4m
RP10
1.8m
RP50
2.4m
RP100
2.5m
RP500
Show on map Break down by NUTS2 Export layer
Ask anything…
🗺 Map 2 layers active

Map Layers

RP100 flood depth
cologne_district_h3
Population > 1,000
highlight filter
© OpenStreetMap · CARTO

See manteo.ai in action

From connection to insight. One workspace, three panels.

Seamlessly combine different datasets Upload your own datasets, connect to live databases or use curated sources.
Upload
Site boundariesAreas you want to analyze
Sales by regionSpreadsheets with locations
CSV
GeoJSON
Shapefile
Parquet

More coming soon

Live connections
Store locationsSynced from your warehouse
Operational metricsAlways up to date
BigQuery
Postgres
Snowflake

More coming soon

Curated sources
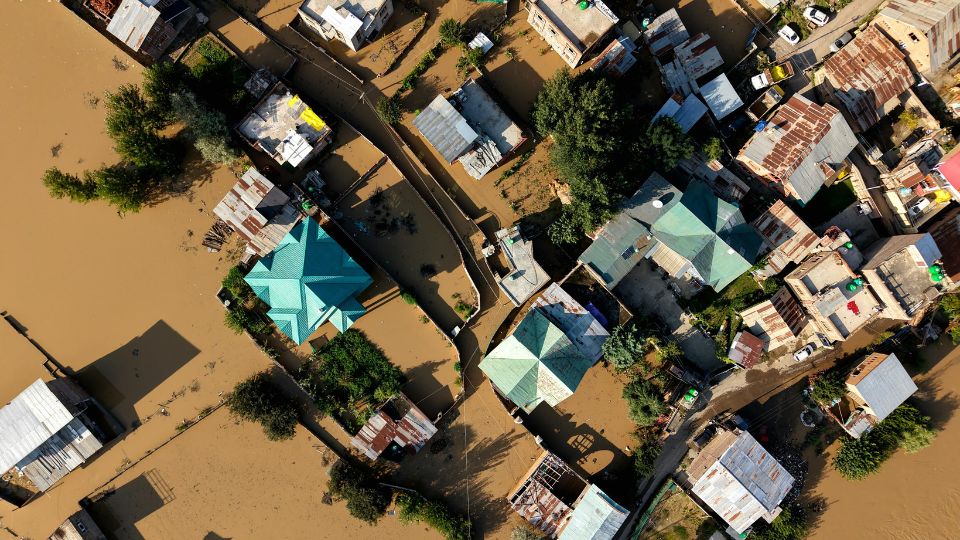
Flood hazard mapsModelled risk layers
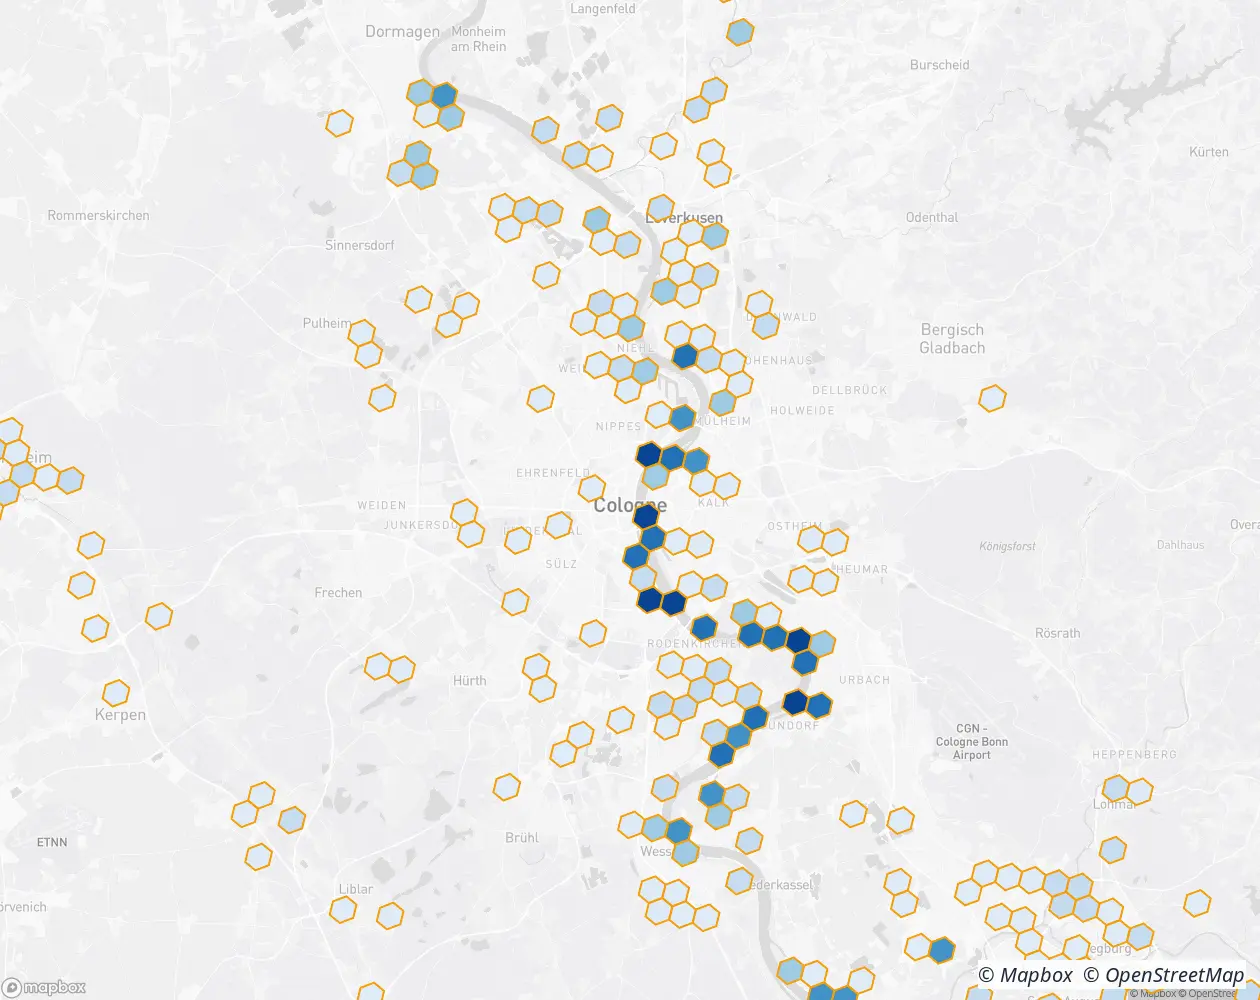
Population gridsWho lives where
STAC
COG
Zarr

More coming soon

✨ Agent follow-up

“Should I rank stores by overlap area, or by population exposed inside the flood zone?”

Data sources

Seamlessly combine different datasets.

Upload your own files, plug in live warehouse connections, or pull from curated sources, then ask anything in plain language.

Explore diverse use cases

Start from workspaces built for real analysis or bring your own use case.

Risk, environment, logistics, demographics, and more. Every team asks different questions. Samples show the range of what you can explore; connect your own data and define the analysis that matters to you.

Wildfire monitoring

Track fire events, burned areas, and response spending alongside administrative boundaries, ready to map and compare regions.

“Map fire-related spending by region”
4 sourcesReady to explore

Flood risk analysis

Combine flood hazard depths, population exposure, and river networks in one workspace to find high-risk corridors.

“Where is 100-year flood depth highest near rivers?”
4 sourcesReady to explore

Water quality & land use

Relate groundwater measurements to agriculture, population density, and river corridors for environmental insight.

“Which river corridors show elevated nitrate levels?”
5 sourcesReady to explore

Supply chain & port risk

Score global port resilience and map exposure along shipping routes with country and maritime context.

“Map ports by overall risk score”
2 sourcesReady to explore

And many more use cases

Whatever spatial question your team has, it's easy with manteo.ai.

Urban planning Site selection Insurance Agriculture Energy Retail geography Climate adaptation Infrastructure + yours

Reported by teams

Less prep. Faster decisions.

Customers move from raw spatial data to decision-ready output in less time, with AI agents that deliver usable maps and insights on the first ask. Geospatial analysis is no longer limited to specialists.

>1/3 of time saved. Teams reclaim more than a third of their time spent finding and preparing data with direct answers in manteo.ai.

>90% agent success rate. Responses arrive ready to use: maps, charts, and insight your team can act on without rework in other tools or spreadsheets.

Anyone can get geospatial insight. Non-technical users ask in plain language and receive maps, charts, and answers without specialist training or waiting on an analyst.

Ready to explore your data?

Create a workspace, connect a source, and ask your first spatial question.